
Calendar shows individual dates; Dashboard helps you see the shape of the year. It answers questions such as “what is coming up soon?”, “which month-end cash balance is lowest?”, “what makes up projected spending?” and “how does the plan look across an Australian financial year?”
Dashboard brings your saved budget and recorded actuals together in one view: upcoming events, month-end cash projections, spending by category and a month-by-month summary. It is a view of the records in Budgetezy, so an item missing from the plan will not appear in the projection.
Open Dashboard and choose the period you want
Choose Dashboard in the top navigation. On a phone, tap the Dashboard icon or open Menu and choose Dashboard.
On a larger screen, use the year navigation controls to move backward or forward.
On a phone, tap the displayed year at the top, then choose a year from Choose year. You can also swipe left or right across an open area of the Dashboard to move one year at a time.
Changing the displayed year does not change the budget.
Switch from a calendar year to an Australian financial year
On a larger screen, look in the Dashboard's Filters panel and turn on Financial Year.
On a phone, tap the filter icon first, then turn on Financial Year.
The Dashboard recalculates the displayed period from 1 July through 30 June. The year shown is the year the period ends: for example, Financial Year 2027 runs from 1 July 2026 to 30 June 2027.
Turn the switch off to return to the calendar-year view.
Estimated net worth is not available in the Australian financial-year view because the current asset/liability balance data is aligned to the calendar-year boundary.
Start with the next 30 days
The Next 30 days card covers today and the following 29 days. It shows scheduled events in that window, including:
- Coming in;
- Going out;
- the net difference; and
- a short list of upcoming events.
Transfers are excluded from the totals and short event list because moving money between Budgetezy accounts is different from receiving income or paying an ordinary expense. They remain visible on the Calendar.
If something looks unexpected, use View in calendar to inspect the underlying events.
Use Money outlook to see the shape of the plan
The Money outlook chart plots the projected cash balance at each month end. A recorded actual uses its recorded amount and date; an occurrence without an actual still follows its saved schedule. Hover over a monthly point to see that month's income, ordinary expenses, net change and ending cash.
Two values answer different questions:
- Projected ending cash — where projected cash sits in the final displayed month;
- Lowest projected cash balance — the lowest month-end balance anywhere in the displayed period.
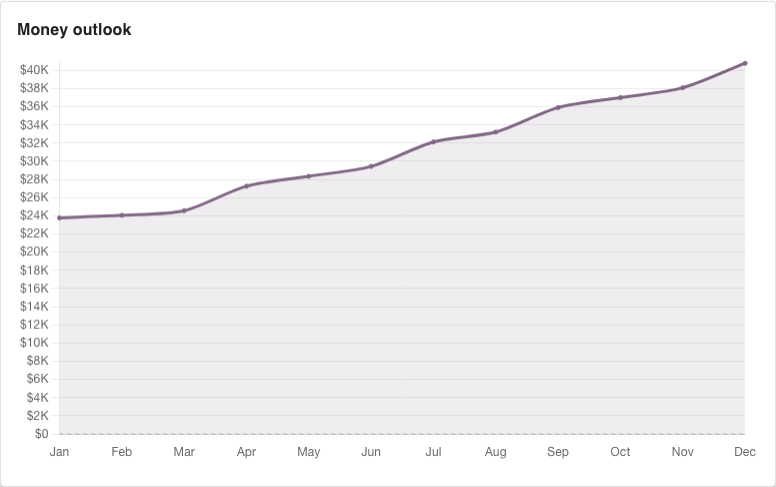
A plan can finish higher while dipping lower earlier. Lowest projected cash balance compares the month-end points shown; it does not identify a lower balance that occurs and recovers between month ends. See How projected cash balances are calculated.
Compare months at a glance
Year at a glance puts projected income, expenses, net change and ending cash on a card for each month. The current month is marked Current. Select a month to open it in Calendar.
See what makes up planned spending
Where your money goes groups ordinary expenses by category and leaves transfers out. It includes recorded actuals for occurrences already recorded.
To trace a monthly total to its items, open Detailed breakdown, expand a group, then select a monthly amount to open the matching Calendar view. You can also open Manage Budget or Calendar to find the underlying item; Dashboard totals are not edited directly.
Use draft budgets to compare an unfinished project plan
Open Filters, then use Show draft budgets to choose the draft project items to include in the Dashboard view.
That lets you inspect their effect without first turning those drafts into active budget items.
See Try project budget items without adding them to the active forecast.
Preview a change before you put it into the live plan
If the question is “what would happen if I changed this?”, choose What If on the Dashboard or open Menu and choose What If.
For one new income or expense, the add form also has a faster Preview action.
See Preview a budget change before you save it.
When a Dashboard number looks wrong
Trace it back to the source record. Check its amount, date, frequency, account, draft selection or balance entry. For actuals, check the amount and date recorded against the occurrence. The Dashboard summarizes those records; it does not keep a separate budget behind the scenes.
See Planned vs recorded amounts for how an actual affects one occurrence, or Use the Budget Calendar to find and open the source item.